Package timexseries_clustering
TIMEX-CLUSTERING (referred as timexseries_clustering in code) is a Python package which implements a pipeline for time-series clustering.
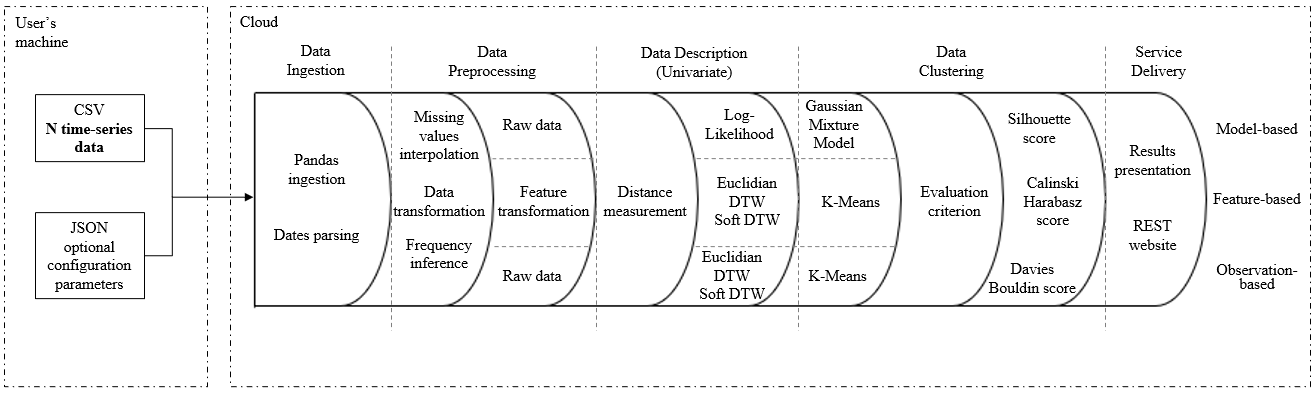
The pipeline consists in:
- time-series data ingestion;
- time-series pre-processing;
- time-series analysis and clustering;
- results visualization.
While TIMEX-CLUSTERING is intended to be use in a fully automatic way (which means that each
step is automatically computed, without user intervention), users can also take
advantage of single parts of the framework.
Reason
Time-series are one of the most important data shapes. An important part of data that we produce and consume everyday can be encoded in the time-series form. For our purposes, time-series are an ordered list of values, each one associated with a timestamp. The values can be the number of units sold that day of a specific product, the heartbeat of a person, the amount of new Covid-19 cases in a specific country or city.
Clustering time-series data has become a popular research topic over the past decades and there is a rich literature on this topic. Clustering is a category of unsupervised learning techniques that allows us to discover hidden patterns in data; these patterns can commonly take place in the dataset. Finding the clusters of time-series can help to real world problems such as anomaly detection (i.e. discover anomalies in sensor databases), recognizing dynamic changes in time-series (i.e. in financial data bases to find companies with similar stock price move), forecasting (i.e. infer likely future behavior based on cluster membership) and for pattern discovery (i.e. in marketing databases different daily patterns of sales can be discovered).
The clustering of time-series is organized into three approaches: The observation-based approach is a direct approach for clustering time-series based on a comparison of the observed time-series or a suitable transformation of the observed time-series. The observation-based approach is recommended when the aim is to identify similar geometric profiles and when the time-series are not very long.
The feature-based metrics are more suitable when the aim is to discriminate between generating processes, that is, between underlying dependence structures. In this approach the clustering target is achieved by using the features extracted, these features highlight higher level dynamic aspects of the time-series; through this approach a dimensional reduction is attained and consequently computational time saving can be achieved.
Finally, in the model-based methods, the time-series under consideration are assumed to have been generated from specific underlying models or by a combination of probability distributions, and the similarity between fitted models is evaluated .
The proposed TIMEX-CLUSTERING framework, developed in Python, is characterized by the pipeline depicted in. Such pipeline comprises the following six steps: data ingestion, data pre-processing, data description, data clustering and service delivery.
TIMEX-CLUSTERING's goal is to provide an automatic clustering framework, which could be used by any user on their datasets with a minimal amount of knowledge about clustering procedures. It should provide efficient and high quality time-series clustering. TIMEX-CLUSTERING will use the three different clustering approaches (observation-based, feature-based and model-based) in order to cover datasets with different nature. It is emphasized that a clustering-as-a-service is not yet available in the literature: this framework will be also unique because will include all the clustering approaches.
Use cases
There are at least two use cases worth mentioning:
- A certain group of time-series is relevant for a group of users. The time-series are updated every
day and can be downloaded in a suitable format (e.g. CSV or XLSX) every day.
Those users would like to have a way to obtain the clusters of such time-series. by installing TIMEX-CLUSTERING on a server, configure the bare minimum requested by TIMEX-CLUSTERING, and start it. A website will be made available, and it will provide a link to the users. - A company is interested in creating a clustering-as-a-service platform where users can upload a CSV file containing some time-series, set some settings or use defaults, and press a button to receive clusters for the uploaded time-series. TIMEX-CLUSTERING can be adapted to work this way.
Get started
Refer to the Examples section of the GitHub repository, or check the covid-19 timex-clustering example or the UAE&UCR dataset timex-clustering example
Architecture
The general architecture of TIMEX-CLUSTERING is here presented:
The most important aspect of TIMEX-CLUSTERING architecture is the configuration options dictionary. It is a key-value list of settings which influences all the key aspects of the pipeline. It can be stored in a JSON file, loaded before the pipeline starts.
Configuration parameters dictionary
An example of working dictionary, used for the UAE&UCR dataset timex-clustering example website is:
{
  "activity_title": "UEA&UCR Dataset - Clustering Example",
  "verbose": "INFO",
  "input_parameters": {
    "source_data_url": "https://raw.githubusercontent.com/uGR17/TIMEX_CLUSTERING/main/examples/datasets/k_means_example_5ts.csv",
    "index_column_name": "date",
    "frequency": "D",
    "timeseries_names":{
      "date": "Date",
      "ts1": "timeseries1",
      "ts2": "timeseries2",
      "ts3": "timeseries3",
    }
  },
  "model_parameters": {
     "clustering_approach": "observation_based,feature_based,model_based",
     "models": "k_means,gaussian_mixture",
     "pre_transformation": "none",
     "distance_metric": "euclidean,dtw,softdtw",
     "feature_transformations": "DWT",
     "n_clusters": [3, 4, 5, 6],
     "gamma": 0.01,
     "main_accuracy_estimator": "silhouette"
  },
  "xcorr_parameters": {
    "xcorr_max_lags": 120,
    "xcorr_mode": "pearson",
    "xcorr_mode_target": "pearson"
  },
  "visualization_parameters": {
    "xcorr_graph_threshold": 0.8,
  }
}
All the options are here described.
General
activity_title: used in the website creation as title for the page. Optional.verbose: it is not strictly used by TIMEX-CLUSTERING, but it can be included here in order to set the verbosity level in the main Python script. In fact, TIMEX-CLUSTERING has important logging capabilities. Optional, can be one of "DEBUG", "INFO", "WARNING", "ERROR", "CRITICAL".
Input parameters
Remember that TIMEX-CLUSTERING expects the input data to be in the following form. Some changes can be forced through settings.
| time_index | time-series A | time-series B | … |
|---|---|---|---|
| 2000-01-01 | x | x | … |
| 2000-01-02 | x | x | … |
| … | … | … | … |
The following options has to be specified:
source_data_url: local or remote URL pointing to a CSV file.
Additionally, some other parameters can be specified:
index_column_name: the name of the column to use as index for the DataFrame. If not specified the first one will be used. This column's values will be parsed with dateparser to obtain a DateTimeIndex;frequency: if specified, the corresponding frequency will be forced. Refer to https://pandas.pydata.org/pandas-docs/stable/user_guide/timeseries.html#offset-aliases for a list of possible values. If not specified the frequency will be infered.columns_to_load_from_url: comma-separated string of columns's names which will be read from the CSV file. If not specified, all columns will be read;timeseries_names: dictionary of key-values (old_name: new_name) used to rename some columns in the CSV;dateparser_options: dictionary of key-values which will be given todateparser.parse(). This is useful to set the date format if it is not common. Refer todateparserdocumentation for the available options.
Selection parameters
These parameters can be used to filter some points in the dataset. This is optional.
column_name_selection: if specified, only the rows in which the value of the column namedcolumn_name_selectionis equal tovalue_selectionare kept. If this is specified, alsovalue_selectionhas to be specified.init_datetime: if specified, only the rows where the Datetimeindex value is greater thaninit_datetimeare kept.end_datetime: if specified, only the rows where the Datetimeindex value is less thanend_datetimeare kept.
Moreover, if dateparser_options is specified in `input_parameters', then the options will be passed to
dateparser to parse the dates.
Model parameters
These parameters control the classes of models used in the clustering, the feature transformation tested, etc.
The following options has to be specified:
clustering_approach: comma-separated list of clustering approaches keywords. Available approaches:"observation_based,feature_based,model_based".models: comma-separated list of lustering models keywords. Available approaches:"k_means,gaussian_mixture". K-Means for the Observation and Feature based approaches, and Gaussian Mixture models for Model based approach.pre_transformation: comma-separated list of pre_transformation keywords. Availables:"none","log"or"log_modified".distance_metric: comma-separated list of distance_metrics keywords. Availables:"euclidean,dtw,softdtw".feature_transformations: comma-separated list of feature_transformations keywords for the Feature based approach. Available:"DWT", using Haar wavelet.n_clusters: list of number of clusters settings to search, for the non-hierarchical clustering models. Example:[3, 4, 5].main_accuracy_estimator: error metric which will be minimized as target by the procedure. It can be one of"silhouette","davies_bouldin"or"calinski_harabasz".gamma: regularization parameter for the soft DWT metric, lower is less smoothed (closer to true DTW). Example:0.01.
Cross-correlation parameters
These parameters controls the cross-correlation computation. This part is optional.
-
xcorr_modes: indicate the different algorithms which should be used to compute the cross-correlation. The computed cross-correlation will be shown in the data visualization part. The available choices are: -
matlab_normalized: same as using the MatLab function xcorr(x, y, 'normalized') pearson: use Pearson formula (NaN values are fillled to 0)kendall: use Kendall formula (NaN values are filled to 0)-
spearman: use Spearman formula (NaN values are filled to 0) -
xcorr_max_lagsis the number of lags, both in positive and negative direction, to which the cross-correlation calculations should be limited to. xcorr_mode_target: which cross-correlation algorithm should be used as target in evaluating useful additional regressors. E.g."pearson".xcorr_extra_regressor_threshold: the minimum absolute value of cross-correlation which indicates a useful extra-regressor. E.g. 0.8.
Visualization parameters
Parameters used to tune the visualization part of TIMEX-CLUSTERING.
xcorr_graph_threshold: This controls the minumum value of cross-correlation for which an arc in the cross-correlation graph is drawn. It should be between 0.0 and 1.0.
Available clustering models
The following models are implemented in TIMEX-CLUSTERING and can be used in the clustering procedure:
- Gaussian Mixture Model: A simple Gaussian Mixture implementation built with sklearn. Keyword:
gaussian_mixture. This model is valid for the Model based clustering approach. - K-Means: A simple K-Means implementation built with ts-learn. Keyword:
k_means. This model is valid for the Observation and Feature based clustering approach.
Available pre-transformations
The following transformations are available on TIMEX_CLUSTERING, which will use them in order to pre-process the time-series and check if this increases the clustering performance on the evaluation criteria.
- Identity: don't modify the values. Keyword:
none. - Logarithmic: Simple logarithmic function, with support for negative values. It uses the formula:
f(x) = sign(x) * log(|x|) if
x> 1, 0 otherwise. However, the modified logarithmic one should be preferred. Keyword:log. - Modified logarithmic: Simple logarithmic function, adapted to work on all the real numbers. It uses the formula:
f(x) = sign(x) * log(|x| + 1).
Keyword:
log_modified.
Expand source code
"""
.. include:: ./documentation.md
"""
Sub-modules
timexseries_clustering.data_clusteringtimexseries_clustering.data_ingestiontimexseries_clustering.data_visualizationtimexseries_clustering.timeseries_container